Beyond the Click: Your 3-Step System for Creative Analysis Video Success
Are your dashboards silent on which videos are actually "winning"? Fragmented data and delayed conversions make true creative analysis video almost impossible. The good news is that you can still reliably pick winners using smart proxy metrics and AI-assisted analysis.
As your AI Creative Buddy, I'm giving you a repeatable, 3-step workflow to produce a definitive creative breakdown report. This system helps you confidently short-list candidates and iterate on what works in video ads, even without perfect funnel attribution.
Step 1: Establish Reliable Proxy Metrics You Can Trust
When conversion data is weak, attention signals become your best early indicator of creative quality. You must focus on metrics that truly analyze video performance and reflect viewer interest.
The Mini-Metric Set (Formulas to Copy)
Hook Rate (HR): Measures early pull HR = 3-second video plays ÷ impressions
Average % Viewed (APV): Reflects depth of interest APV = (average view duration ÷ video length) × 100
Completion Rate (CR): Signals story success CR = completed views (100%) ÷ total plays
Engagement Rate (ER): Shows resonance ER = (likes + comments + shares + saves) ÷ views × 100
How to Read the Data Fast
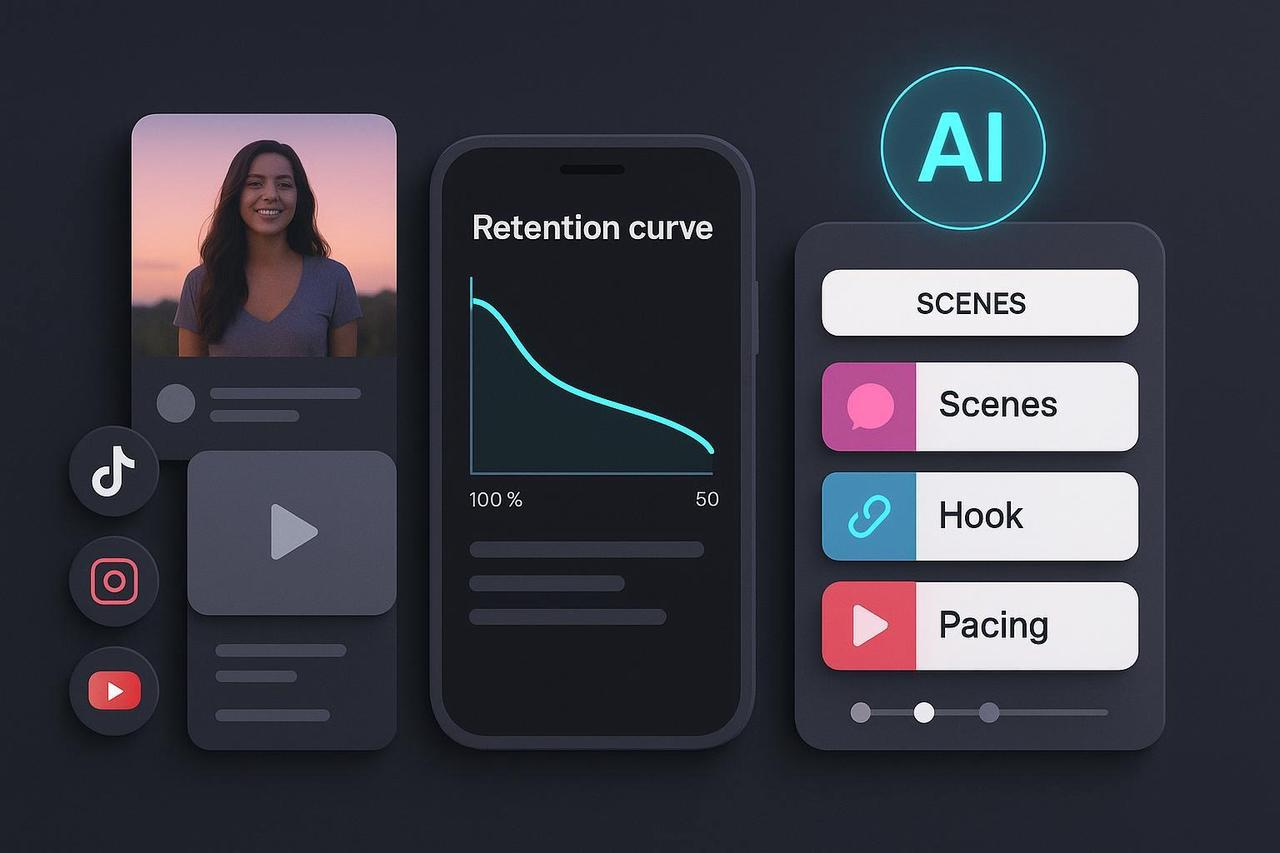
Hook Rate and Retention: A sharp early drop suggests your hook isn’t clear or text isn't readable on mobile. Use YouTube's Audience retention analytics to read retention curves and spot drop-offs.
Completion/APV: These reflect deeper engagement and are strong predictors of downstream success.
Why Combine Signals: The IAB 2024 Attention Measurement Explainer emphasizes combining multiple attention signals for a truer picture of creative quality.
Checkpoint: After ≥ 3,000 to 5,000 impressions per creative, if two attention proxies (e.g., retention through 25% and completion rate) beat your control by ~ 10 to 20%, consider that creative a shortlist candidate.
Step 2: Use AI to Analyze and Iterate the Right Way
Proxies tell you what performed; AI and structured review tell you why. Use a checklist to generate a creative breakdown report and create clean variants for visual A/B analysis.
AI/Structured Review Checklist
Hook Clarity in 0 to 3s: Is the value or tension visually obvious for a silent, mobile-first viewer?
On-Screen Text: Is it high-contrast, large enough, and displayed for ~ 1.5 to 2.5 seconds per line?
Pacing: Did you avoid long static shots? Do cuts align to the beat to keep momentum?
Key Visual Detection: Are the clearest demo shots and social proof moments front-loaded?
Creating Variants for Visual A/B Analysis
The key to learning what works in video ads is isolating variables.
One Element at a Time: Change only one element in the opening (first frame, first line of text, first spoken line) while keeping the mid-body constant.
Naming Conventions: Build 3 to 6 hook variants per master creative and use standardized names (e.g., HOOK_A_TextFirst, HOOK_B_DemoFirst) to enable clean comparisons.
NemoVideo Acceleration: An AI editor like NemoVideo accelerates this iteration. You can upload your master cut, have the AI auto-detect key visuals, and then generate 3 to 6 hook variants in bulk by swapping the opening shot, text, and CTA phrasing for quick micro-tests.
Evidence Check: Prioritize attention-led iteration. Nielsen's 2024 expansion of its creative evaluation suite confirms that attention signals can reliably benchmark creative quality across campaigns.
Step 3: Validate Incrementality with Lightweight Experiments
Proxies shortlist winners; experiments confirm impact. Your final step for creative analysis video success is validating those shortlisted creatives with systematic testing.
Micro-Test Design
Isolate and Test: Run 3 to 5 creatives with equal budgets to the same audience for 48 to 96 hours.
Decision Rule: Promote a winner if two attention proxies and one early downstream signal (e.g., CTR) consistently beat the control by your preset effect size over ≥ 5k impressions.
Platform Lift Tests: When eligible, use platform tools like Meta’s Conversion Lift or TikTok’s Conversion Lift Study to confirm incremental conversions using randomized holdouts.
The Continuous Improvement Loop
Weekly: Run a small micro-test; use attention proxies to shortlist winners.
Biweekly: Ship 3 to 6 new hook variants for your top concepts.
Monthly/Quarterly: Validate a top concept with a platform lift test or a geo holdout experiment (refer to Think with Google's Modern Measurement Playbook for best practices). This creates reliable content engagement insights.
Checkpoint: Promote a creative from "shortlist" to "winner" only if it clears your micro-test decision rule and holds up in a subsequent lift or geo test when feasible.
Final Word
Stop relying on slow, incomplete funnel data to drive your creative decisions. By establishing reliable proxy metrics and using AI for visual A/B analysis, you can generate a high-confidence creative breakdown report every week.